Comparing 3 Popular JavaScript Charting Libraries
Many websites need to visualize data in charts. This article compares three of the most popular open source charting libraries (Chart.js, Plotly.js and ECharts) from the perspective of the software developer.
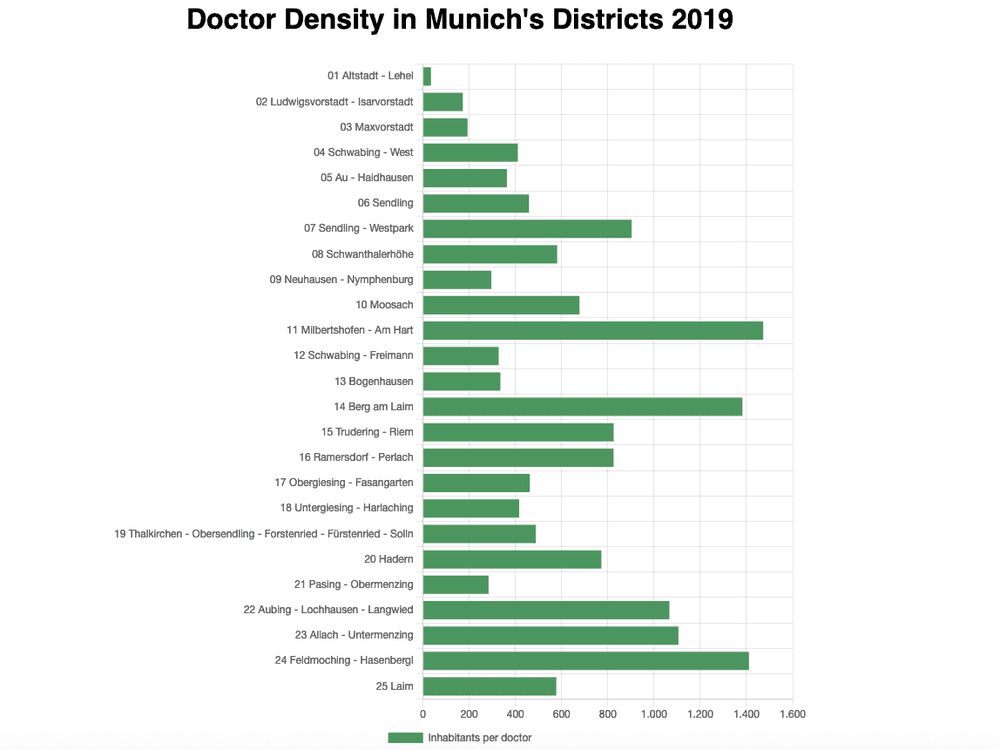
In order to compare the three libraries, I created a horizontal chart with open data from the city of Munich. The bar chart will display the number of doctors in each district of Munich. The higher the number, the lower the density of doctors in the district.
The example applications are written in JavaScript with the Lit framework, a thin layer over the web components standard. There are a number of wrapper libraries for such frameworks as React and Vue, but since we use Lit, we do not need them. This keeps the code simple.
Chart.js
Chart.js is a popular open source JavaScript charting library. It has 53.7k stars on GitHub and a good ecosystem with wrappers for Vue, React, Ember and other frameworks. Furthermore, it has a selection of plugins for things like support for streaming data, financial charts and crosshairs. The library uses the browser canvas to draw the charts. The first contributions are from 2013, and it is still under active development with the last contributions at the day of writing this article. It is an independent project with many contributors from the community. Chart.js supports eight chart types out of the box, like bar charts, line charts, but also bubble charts, scatter charts and polar charts.
For the purpose of this article, I implemented a horizontal bar chart with the open data from the city of Munich. With help from the Chart.js documentation, I could easily develop the example application with Lit web components and the result is the following chart:

When hovering with the mouse over the bars, the application displays an informative tooltip. Chart.js displays the long labels correctly, and I could easily set the custom green fill color for the bars.
You can read the code and download the Chart.js demo application via this link: https://github.com/tderflinger/chart-libs-comparison/tree/master/chartjs-example
Plotly.js
The charting library Plotly.js was developed by the Plotly Inc. company based in Canada. It is part of a larger data analysis offering and is open source. Plotly.js offers a great variety of chart types, from line and bar charts to statistical charts, like histograms and box plots, and also financial and scientific charts. The focus of Plotly.js is clearly the data analysis and visualization domain for data science. The library has 13.2k stars on GitHub and is actively maintained at the date of writing this article. The company Plotly also offers charting libraries for Python and R which are based on Plotly.js.
The example application chart that I created looks similar to the one depicted for Chart.js, but the long labels are cut off. Other differences to the Chart.js chart is that Plotly.js offers by default a crosshair cursor and a toolbar. With the toolbar, you can download the chart as an image and box select values from the chart, among other tasks.
I found the library easy to use, and I am sure there is a solution for the long labels.
You can find the source code for the Plotly.js charting example under the following link: https://github.com/tderflinger/chart-libs-comparison/tree/master/plotlyjs-example
ECharts
ECharts is an Apache JavaScript charting project. Apache is an open source software foundation. The project has the backing of contributors from major Chinese internet companies like Baidu, Tencent and Alibaba. ECharts can render the charts both on a canvas and in vector format as an SVG. It offers a great variety of charts among which are scatter charts, radar charts, tree charts, funnels and many more. The library is optimized for mobile usage. ECharts also has 3D charts in its offering. It has a good ecosystem with support for many frameworks like Vue and React, as well as for other languages like Julia. On GitHub, it has 46.5k stars. It is actively developed on GitHub.
When I tried the library, I found it easy to use and the horizontal bar chart was correctly rendered with the long labels.
You can view the source code of my sample application by following this link: https://github.com/tderflinger/chart-libs-comparison/tree/master/echarts-example
Conclusion
The three charting libraries have different strengths and weaknesses. Chart.js and ECharts are the most popular and have a good ecosystem. ECharts offers a greater variety of charting types, while Chart.js has mature English documentation. When your needs are in the area of data science, Plotly.js is the library to look at. Overall, all three libraries have good developer experience.
References
-
Chart.js: https://www.chartjs.org
-
ECharts: https://echarts.apache.org
-
Plotly.js: https://plotly.com/javascript/
-
Open data from city of Munich: https://www.opengov-muenchen.de/dataset/indikatorenatlas-gesundheit-aerztedichte-83r65mct
-
Lit framework: https://lit.dev/
Published
23 May 2021

Written by Thomas Derflinger
I am a software entrepreneur who builds innovative solutions. On this blog, I share practical guides and insights on web development, IoT and AI.